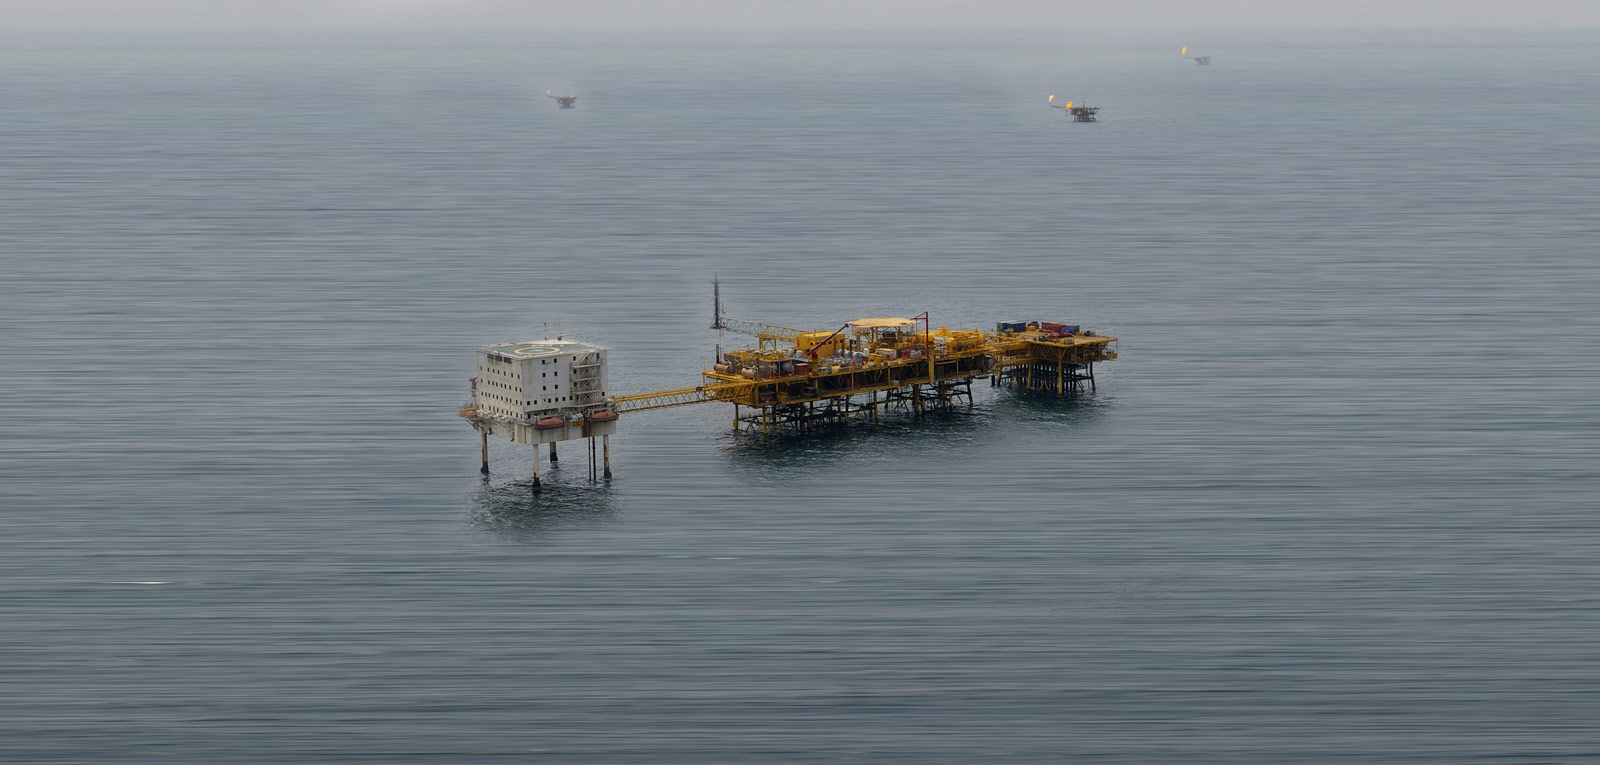
Key figures from 1st January to 30 April 2025:
-
National crude oil production: 6.528 million barrels
-
Quantities of crude oil exported on behalf of the State: 4.027 million barrels
-
National natural gas production: 852.227 million m3
-
Quantities of natural gas supplied to the Kribi Thermal Power Plant for electricity generation: 31.22 million m3
-
Quantities of natural gas delivered to the KEDA ceramics plant: 19.50 million m3
-
Quantities of domestic gas supplied to the local market: 10 551.185 metric tons
-
Quantities of liquefied natural gas exported on behalf of the State: 25 212 120 million BTU (MMBTU)
Transfers to the State
-
159.920 billion CFAF in contributions to the State budget;
-
12.149 billion CFAF in corporate income tax (CIT);
-
0.582 billion CFAF in petroleum CIT;
-
3.832 billion CFAF in various other taxes.
About the transfers made by SNH to the State
In accordance with its mission, the National Hydrocarbons Corporation (SNH) transfers to the State revenues from the sale of hydrocarbons, after deduction of expenses.
When referring to transfers to the State, two terms are used: transferable balance and transferred balance.
The transferable balance is taken from the Table of Oil Operations, a forecast table of income and expenditure, which is updated at the beginning of each quarter.
An adjustment is made at the end of each quarter to take into account final payments.
Adjustments done in the 4th quarter of a given fiscal year are taken into account in the 1st quarter of the following fiscal year.
Based on this mechanism, there is necessarily either a windfall (too much transferred) or a shortfall (less transferred) charged to the following year.
The balance transferred corresponds to the amount that is effectively transferred during a given fiscal year. These transfers are recorded as revenue in the State Financial Operations Table (TOFE) under the heading "SNH Royalties".
Recap on production, sales and payments per fiscal year
2025 Summary table (Pdf or Excel)
2023 Summary table (Pdf or Excel) 2024 Summary table (Pdf)
2022 Summary table (Pdf or Excel) 2021 Summary table (Pdf or Excel)
2020 Summary table (Pdf or Excel) 2019 Summary table (Pdf or Excel)
2018 Summary table (Pdf or Excel) 2017 Summary table (Pdf or Excel)
2016 Summary table 2015 Summary table
2014 Summary table 2013 Summary table
2012 Summary table 2011 Summary table
2010 Summary table 2009 Summary table
2008 Summary table 2007 Summary table
Details accounts of SNH
Mandate of the state
Summary of financial statements
2021(General report) 2021(Summary) 2020 2019 2018 2017 2016
Certification reports
2021 2020 2019 2018 2017 2016 2015 2014 2013
Company
Summary of financial statements
2022 2021(General report) 2021(Summary) 2020 2019 2018 2017
Certification reports
2022 2021 2020 (General report) 2020 (Special report)
2019 2018 2017 2016 2015 2014 2013


